Fig. 19
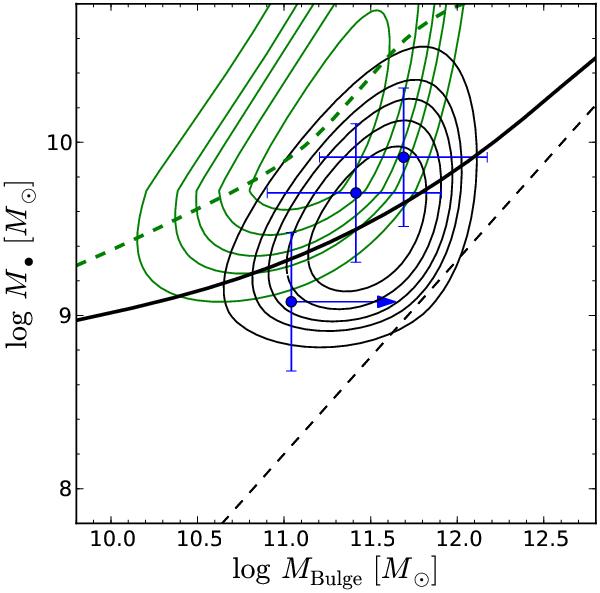
M• and M ∗ measurements of high-luminosity quasars at z ≈ 3 from Schramm et al. (2008). The black contours show the predicted M•-MBulgeprobability distribution using model 2 for the null hypothesis of no evolution in M• /MBulge . For comparison, the offset green contours show the expected distribution if M• /MBulge were to evolve as strongly as with γ = 2.
Current usage metrics show cumulative count of Article Views (full-text article views including HTML views, PDF and ePub downloads, according to the available data) and Abstracts Views on Vision4Press platform.
Data correspond to usage on the plateform after 2015. The current usage metrics is available 48-96 hours after online publication and is updated daily on week days.
Initial download of the metrics may take a while.