Fig. 18
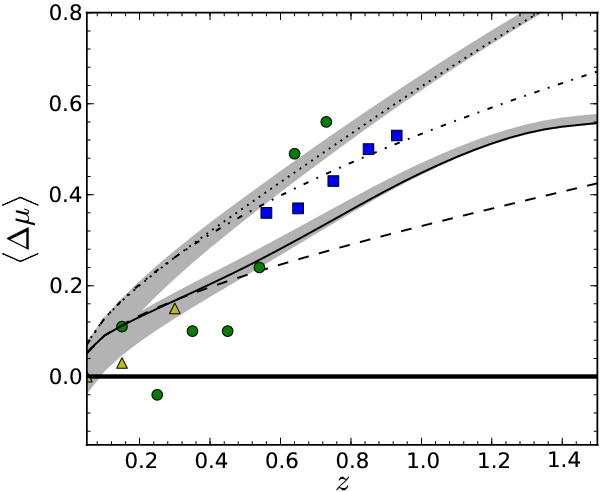
Observed and predicted redshift evolution of the offset in black hole masses for a sample of SDSS quasars. The green circles show the data from Salviander et al. (2007), using the [O iii] line width as surrogate of σ ∗ , the blue squares show their results using [O ii], and the yellow triangles show the results from Shen et al. (2008). The dashed and solid lines shows our model 1 and model 2, respectively, assuming no intrinsic evolution in the M•-σ ∗ relation. The dashed-dotted and dotted lines give the predicted sample offsets for an evolution with γ = 1 for the two models. The shaded areas again incorporate the uncertainty on the spheroid mass function.
Current usage metrics show cumulative count of Article Views (full-text article views including HTML views, PDF and ePub downloads, according to the available data) and Abstracts Views on Vision4Press platform.
Data correspond to usage on the plateform after 2015. The current usage metrics is available 48-96 hours after online publication and is updated daily on week days.
Initial download of the metrics may take a while.