Fig. 17
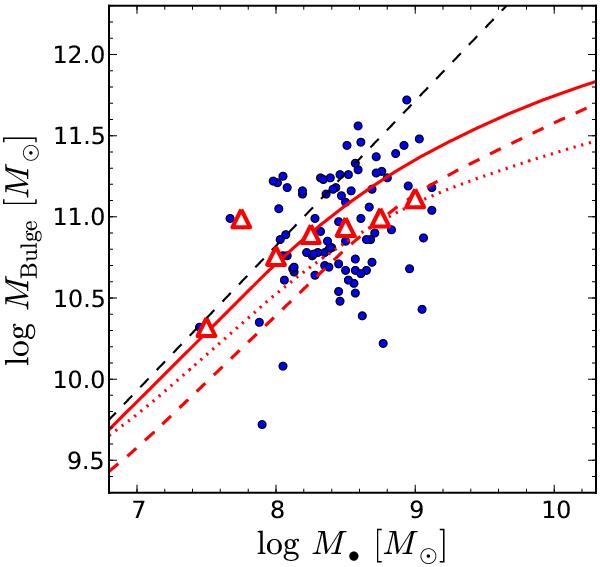
Comparison of predictions for the relation of mean stellar mass at given black hole mass ⟨ s ⟩ (μ) with the data from Merloni et al. (2010). The blue circles show their data, the red triangles give their mean stellar masses in black hole mass bins. These are compared with predictions of ⟨ s ⟩ (μ) using our model 2. We employ the case of no evolution in the M•-MBulgerelation and an intrinsic scatter of σ = 0.3 (solid line), evolution in this relation with gamma = 1 (dashed line) and for a higher intrinsic scatter of 0.5 dex but no evolution in the relation (dotted line). The black dashed line again indicates the true M•-MBulgerelation.
Current usage metrics show cumulative count of Article Views (full-text article views including HTML views, PDF and ePub downloads, according to the available data) and Abstracts Views on Vision4Press platform.
Data correspond to usage on the plateform after 2015. The current usage metrics is available 48-96 hours after online publication and is updated daily on week days.
Initial download of the metrics may take a while.