Fig. 16
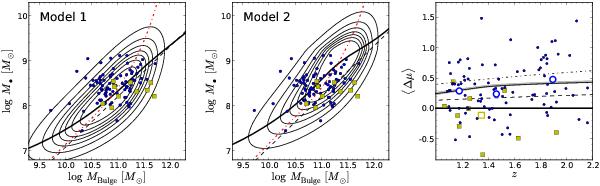
Left and middle panels: predicted M•-MBulgeprobability distributions for the samples of Merloni et al. (2010) (blue filled circles) and Jahnke et al. (2009) (yellow squares), using our model 1 (left) and model 2 (middle) assumptions about the distribution functions. In each panel, the black solid line shows ⟨ μ ⟩ (s), the red dashed-dotted line shows ⟨ s ⟩ (μ), and the thin black dashed line delineates the reference z ≈ 0 relation. Right panel: redshift dependence of the observed M• /MBulge ratios, expressed as offset Δμ from the z = 0 relation, together with the predicted evolution of the sample bias. The symbols are as before, plus the large open circles that show the mean offset for the Merloni data in three redshift bins, and the large open square showing the mean of the Jahnke data. The dashed line shows our prediction for model 1, the solid line with the shaded area shows our prediction for model 2, including the uncertainties on the spheroid mass function. The dashed-dotted line is for model 1, but assuming evolution in the M•-MBulgerelation M•/MBulge ∝ (1 + z).
Current usage metrics show cumulative count of Article Views (full-text article views including HTML views, PDF and ePub downloads, according to the available data) and Abstracts Views on Vision4Press platform.
Data correspond to usage on the plateform after 2015. The current usage metrics is available 48-96 hours after online publication and is updated daily on week days.
Initial download of the metrics may take a while.