Fig. 13
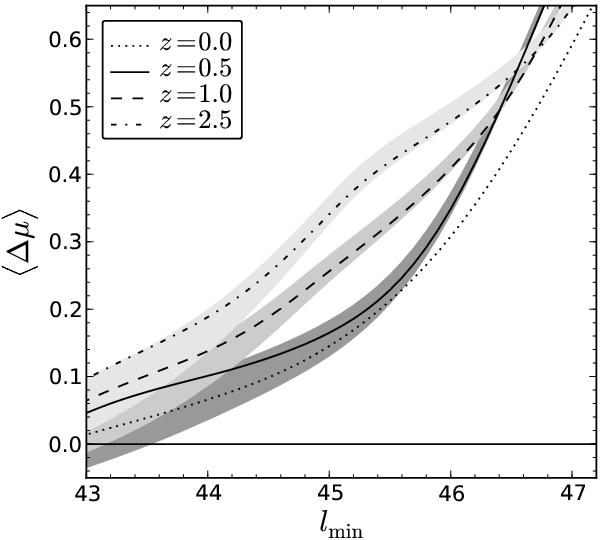
Expected sample bias as a function of the lower luminosity limit for the same representative redshifts as in Fig. 12. The dotted line shows the z ≈ 0 prediction, the other lines show predictions at higher z. The shaded area incorporates the uncertainty on the spheroid mass function, by using the total mass function as upper limit and an estimate of the elliptical mass function as lower limit.
Current usage metrics show cumulative count of Article Views (full-text article views including HTML views, PDF and ePub downloads, according to the available data) and Abstracts Views on Vision4Press platform.
Data correspond to usage on the plateform after 2015. The current usage metrics is available 48-96 hours after online publication and is updated daily on week days.
Initial download of the metrics may take a while.