Fig. 10
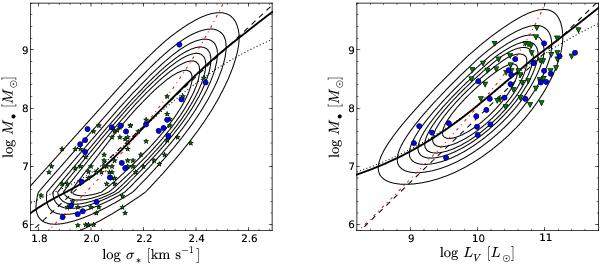
Comparison of our bivariate probability distribution Ψo(s,μ) (contours), assuming reasonable numbers for the selection function, with observational data of low-redshift AGN. The thick black line shows the mean relation ⟨ μ ⟩ (s), the red dashed dotted line shows ⟨ s ⟩ (μ), the black dashed line gives the true relation. The dotted lines shows the mean relation ⟨ μ ⟩ (s) including measurement uncertainties in s of 0.05 dex for σ∗ and 0.1 dex for LV. Left panel: M•-σ∗ relation. We show stellar velocity dispersion measurements for the reverberation mapping sample (blue circles, Woo et al. 2010), and a local SDSS sample (green stars, Greene & Ho 2006). Right panel: M• − LV relation for the reverberation mapping sample (blue circles, Bentz et al. 2009b) and a local QSO host galaxy sample (green triangles, Kim et al. 2008).
Current usage metrics show cumulative count of Article Views (full-text article views including HTML views, PDF and ePub downloads, according to the available data) and Abstracts Views on Vision4Press platform.
Data correspond to usage on the plateform after 2015. The current usage metrics is available 48-96 hours after online publication and is updated daily on week days.
Initial download of the metrics may take a while.