Fig. 1
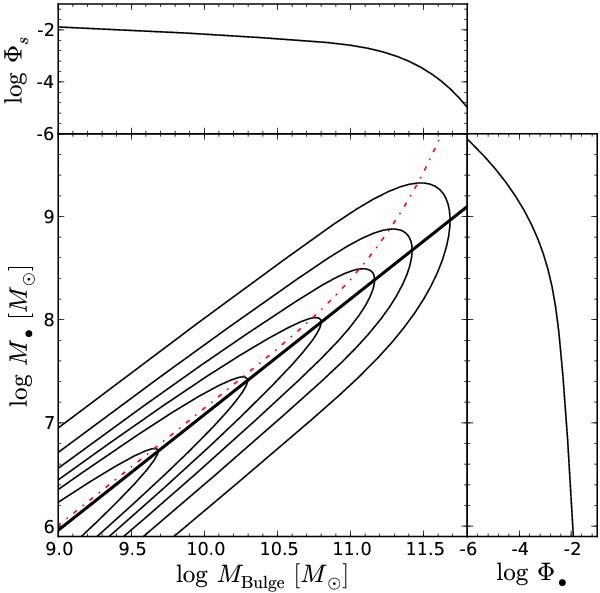
Bivariate probability distribution function of bulge masses and black hole masses with no selection effects. The contours indicate decreasing probability in logarithmic units. The thick black line shows the input M•-MBulgerelation from Häring & Rix (2004). The red dot-dashed line shows the mean galaxy property at a given black hole mass. The upper panel shows the projection of the bivariate distribution function to the bulge mass, i.e. the spheroid mass function. The right panel shows the projection to black hole mass, i.e. the quiescent black hole mass function.
Current usage metrics show cumulative count of Article Views (full-text article views including HTML views, PDF and ePub downloads, according to the available data) and Abstracts Views on Vision4Press platform.
Data correspond to usage on the plateform after 2015. The current usage metrics is available 48-96 hours after online publication and is updated daily on week days.
Initial download of the metrics may take a while.