Free Access
Fig. 3
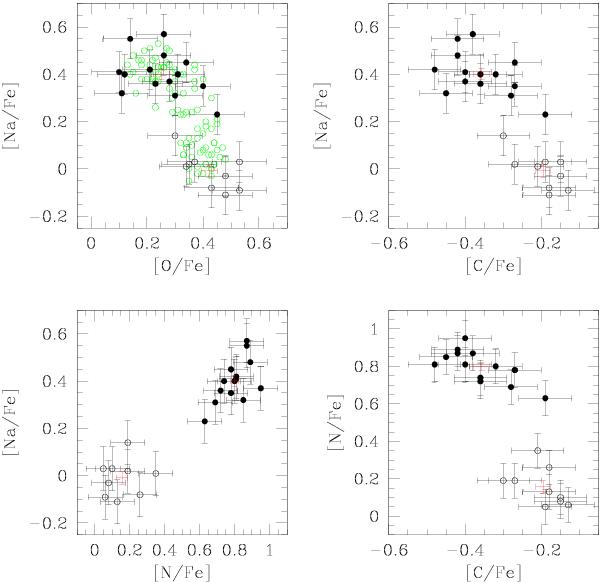
Correlation between light-elements (C, N, O, Na) as obtained from our GIRAFFE stars. Green points in the upper left panel are the results by Marino et al. (2008). N-poor stars are indicated as open circles, while N-rich as filled circles. Red crosses represent the mean value for each sub-population.
Current usage metrics show cumulative count of Article Views (full-text article views including HTML views, PDF and ePub downloads, according to the available data) and Abstracts Views on Vision4Press platform.
Data correspond to usage on the plateform after 2015. The current usage metrics is available 48-96 hours after online publication and is updated daily on week days.
Initial download of the metrics may take a while.