Fig. 5
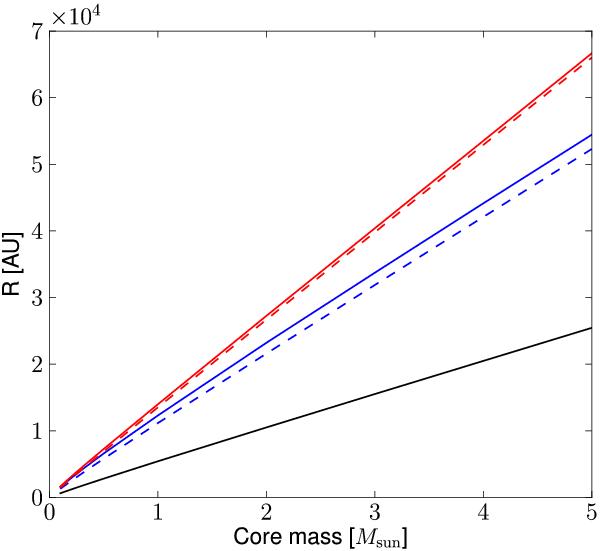
Physical radii of type 1 (blue solid line) and type 2 (red solid line) critical cores as a function of core mass. The black curve represents homogeneous spheres in virial equilibrium (zero outside pressure) with temperature corresponding to the mean temperature of the 1 M⊙ type 1 MBES. Also plotted are the physical radii of critical isothermal cores corresponding to the mean temperature of each non-isothermal core (dashed lines; see text).
Current usage metrics show cumulative count of Article Views (full-text article views including HTML views, PDF and ePub downloads, according to the available data) and Abstracts Views on Vision4Press platform.
Data correspond to usage on the plateform after 2015. The current usage metrics is available 48-96 hours after online publication and is updated daily on week days.
Initial download of the metrics may take a while.