Fig. 1
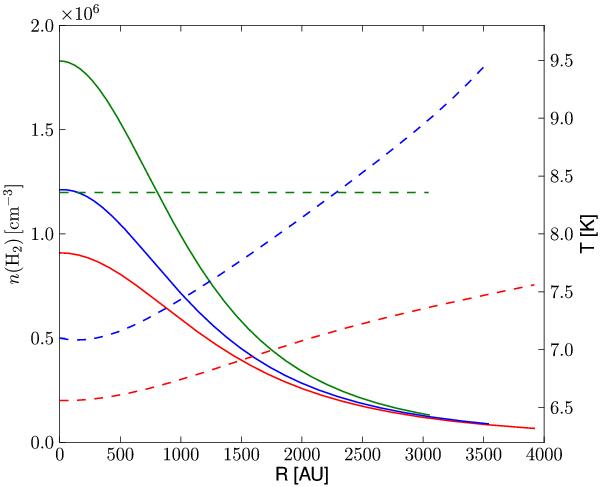
H2 number density (solid lines, left y-axis) of critical 0.25 M⊙ type 1 (OH94, blue) and type 2 (LD01, red) MBESs as a function of radial distance from core center. Also plotted is the density profile of the critical 0.25 M⊙ BES corresponding to the mean temperature of the type 1 MBES (green solid line; see text). The temperature profiles of the respective cores are plotted as dashed lines (right y-axis).
Current usage metrics show cumulative count of Article Views (full-text article views including HTML views, PDF and ePub downloads, according to the available data) and Abstracts Views on Vision4Press platform.
Data correspond to usage on the plateform after 2015. The current usage metrics is available 48-96 hours after online publication and is updated daily on week days.
Initial download of the metrics may take a while.