Free Access
Fig. 1
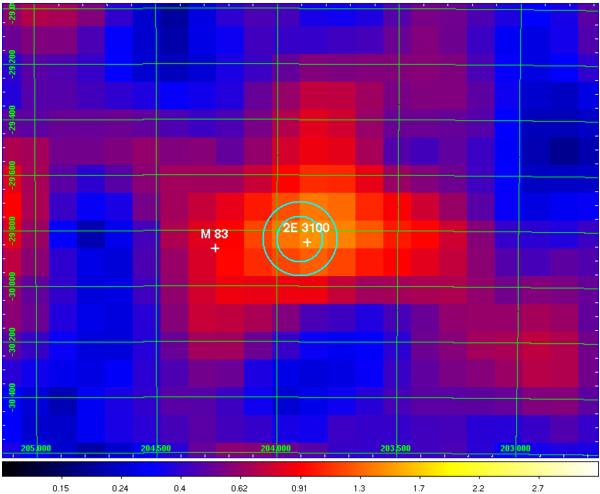
Smoothed count map of the region of interest around M 83, in the 1 GeV–200 GeV energy range. The nominal positions of M 83 and the blazar 2E 3100 are shown in white. The best-fit position, at 68% and 95% confidence levels, of the Fermi/LAT excess is shown in blue.
Current usage metrics show cumulative count of Article Views (full-text article views including HTML views, PDF and ePub downloads, according to the available data) and Abstracts Views on Vision4Press platform.
Data correspond to usage on the plateform after 2015. The current usage metrics is available 48-96 hours after online publication and is updated daily on week days.
Initial download of the metrics may take a while.