Fig. 8
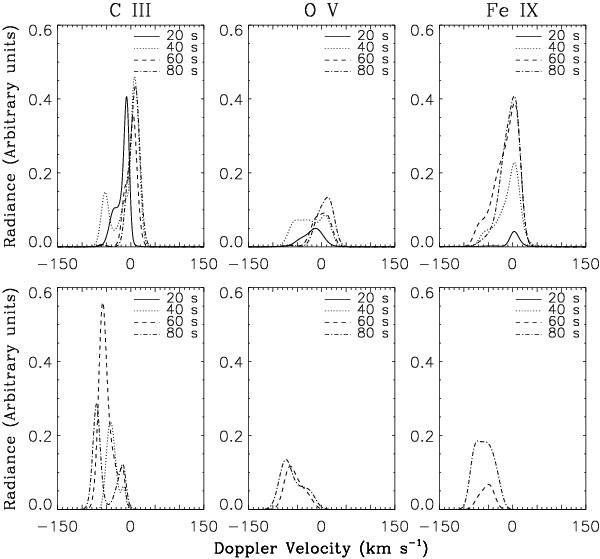
Line profiles of C iii 977 Å line (left column), O v 629 Å line (middle column), and Fe ix 171 Å line (right column) at four times for case A2, where the line radiance is shown as a function of Doppler shift. Each row shows the observations between certain heights. Top row: y1 = 0 and y2 = 2 (P1); bottom row: y1 = 2 and y2 = 5 (P2).
Current usage metrics show cumulative count of Article Views (full-text article views including HTML views, PDF and ePub downloads, according to the available data) and Abstracts Views on Vision4Press platform.
Data correspond to usage on the plateform after 2015. The current usage metrics is available 48-96 hours after online publication and is updated daily on week days.
Initial download of the metrics may take a while.