Free Access
Fig. 7
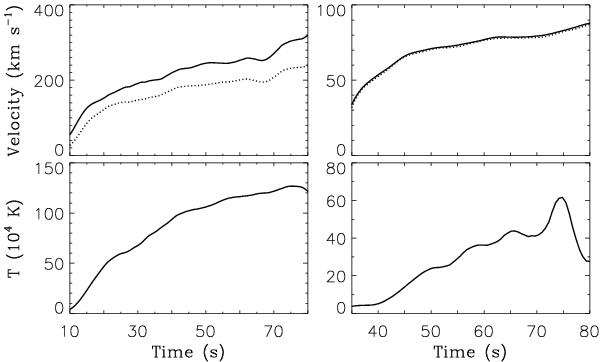
Evolution of the physical quantities, e.g. maximum jet velocity (solid line, top row), its line-of-sight component (dotted line, top row), and the plasma temperature (bottom row) at the location of the peak jet velocity for case A2. Left column: measured at P1, and right column: measured at P2.
Current usage metrics show cumulative count of Article Views (full-text article views including HTML views, PDF and ePub downloads, according to the available data) and Abstracts Views on Vision4Press platform.
Data correspond to usage on the plateform after 2015. The current usage metrics is available 48-96 hours after online publication and is updated daily on week days.
Initial download of the metrics may take a while.