Free Access
Fig. 7
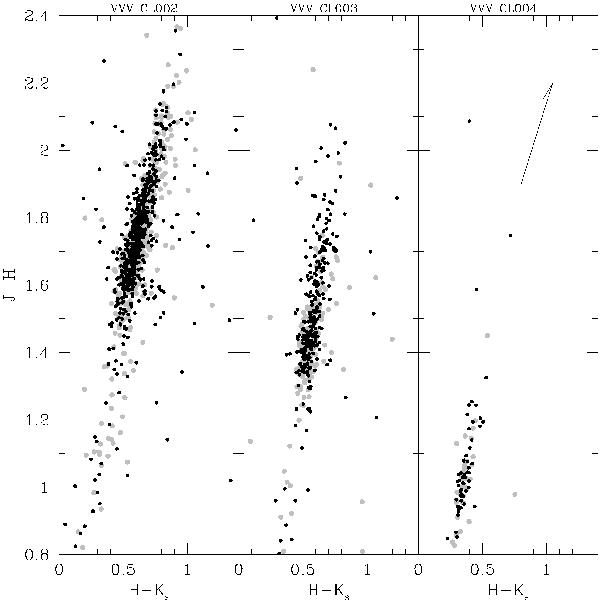
Color–color diagrams of the three cluster candidates (black dots) and their comparison fields (gray dots). The plot was restricted to stars brighter than Ks = 15. The arrow in the right panel shows the direction of the reddening vector.
Current usage metrics show cumulative count of Article Views (full-text article views including HTML views, PDF and ePub downloads, according to the available data) and Abstracts Views on Vision4Press platform.
Data correspond to usage on the plateform after 2015. The current usage metrics is available 48-96 hours after online publication and is updated daily on week days.
Initial download of the metrics may take a while.