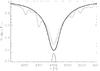
Fig. 12
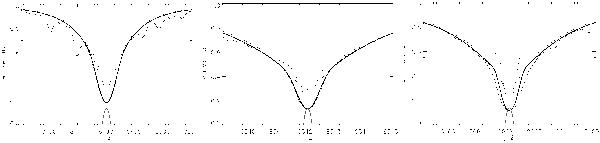
Fits of the NLTE Ca II triplet line profiles in β Cet. The dotted line is the observations from NARVAL at TBL with a resolution of ~ 65 000. The dashed line is the Eriksson et al. (1983) model atmosphere with a chromosphere (Tp = 5500 K). The thin full line is the interpolated MARCS model. The thick full line is our hybrid model with a chromosphere (Tp = 4500). The grey lines below the spectral line profiles show the rotation profiles with a projected rotational velocity of 5 km s-1.
Current usage metrics show cumulative count of Article Views (full-text article views including HTML views, PDF and ePub downloads, according to the available data) and Abstracts Views on Vision4Press platform.
Data correspond to usage on the plateform after 2015. The current usage metrics is available 48-96 hours after online publication and is updated daily on week days.
Initial download of the metrics may take a while.