Fig. 7
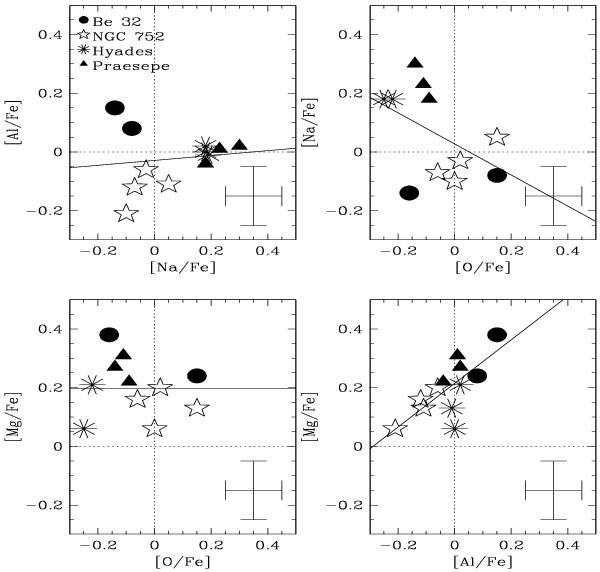
A search for (anti)-correlations of Al, Mg, Na, and O among our target stars. The four panels show different planes of abundance ratios, where stars belonging to each cluster are marked with different symbols. Dotted lines show solar values, solid lines show linear regressions and the typical uncertainty (~0.1 dex) is marked at the lower right corner of each panel.
Current usage metrics show cumulative count of Article Views (full-text article views including HTML views, PDF and ePub downloads, according to the available data) and Abstracts Views on Vision4Press platform.
Data correspond to usage on the plateform after 2015. The current usage metrics is available 48-96 hours after online publication and is updated daily on week days.
Initial download of the metrics may take a while.