Fig. 3
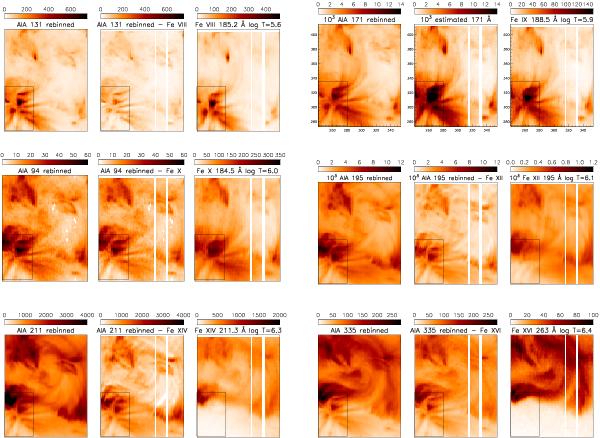
For each band, the plots (negative, linear scale) show: (left) SDO/AIA images rebinned to the EIS resolution; (middle) AIA images with the contribution from the “dominant” ion subtracted (with the exception of the 171 Å see text); (right) radiances in a selection of Hinode EIS lines, with the log T[K] of peak formation temperature (in equilibrium) indicated. The vertical blank lines are due to missing data. The colorbars for the EIS radiances indicate the actual calibrated units (phot cm-2 s-1 arcsec-2), those in the other images DN s-1 EIS pixel-1. The FOV of these images is 117.8 and 140.0 arcsec in the E-W and N-S direction. Their centers are 298.2, 344.3 arcsec from Sun center. The boxed areas indicate the FOV of Fig. 5, where strong cool emission is present.
Current usage metrics show cumulative count of Article Views (full-text article views including HTML views, PDF and ePub downloads, according to the available data) and Abstracts Views on Vision4Press platform.
Data correspond to usage on the plateform after 2015. The current usage metrics is available 48-96 hours after online publication and is updated daily on week days.
Initial download of the metrics may take a while.