Free Access
Fig. B.1
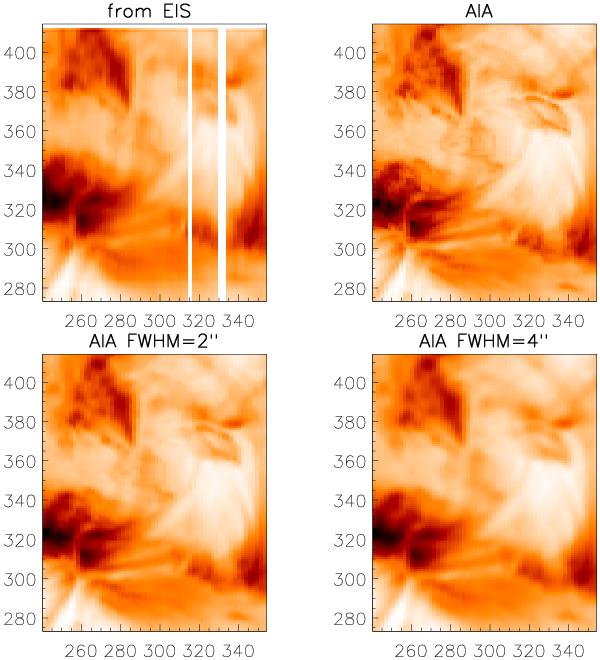
Top left: an image in the AIA 193 Å band, as predicted from the Hinode EIS spectra. The other images are obtained from the AIA 193 Å data, rebinned onto the EIS spatio-temporal scale. The top right is without convolution, while the other two are convolved with a PSF of FWHM of 2 and 4″.
Current usage metrics show cumulative count of Article Views (full-text article views including HTML views, PDF and ePub downloads, according to the available data) and Abstracts Views on Vision4Press platform.
Data correspond to usage on the plateform after 2015. The current usage metrics is available 48-96 hours after online publication and is updated daily on week days.
Initial download of the metrics may take a while.