Fig. 4
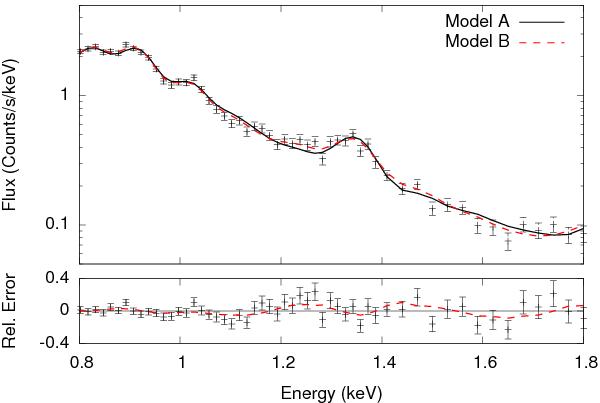
A plot of the mos 2 data with model A and model B in the range 0.8 − 1.8 keV. The bottom part of the figure shows the relative error between model A and the data, while the dashed red line shows model B – model A. It is clear that model B follows the overall shape of the data better than model A. For example, model A shows a residual at ~1.25 keV, whereas model B improves the fit of this region due to the Fe xvii recombination edge at 1.26 keV.
Current usage metrics show cumulative count of Article Views (full-text article views including HTML views, PDF and ePub downloads, according to the available data) and Abstracts Views on Vision4Press platform.
Data correspond to usage on the plateform after 2015. The current usage metrics is available 48-96 hours after online publication and is updated daily on week days.
Initial download of the metrics may take a while.