Free Access
Fig. 2
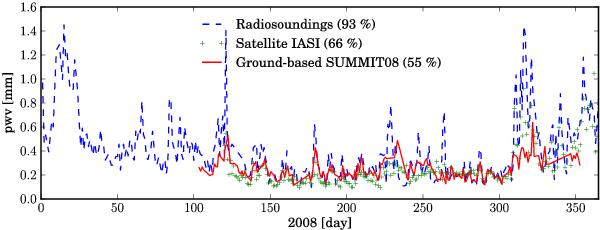
Precipitable Water Vapour (PWV) in [mm] in 2008 at the Concordia Station measured in situ by SUMMIT08 (red line), by radiosoundings (blue line) and from space by IASI (green line). Percentages indicate the fraction of time that each of the instruments worked during the year.
Current usage metrics show cumulative count of Article Views (full-text article views including HTML views, PDF and ePub downloads, according to the available data) and Abstracts Views on Vision4Press platform.
Data correspond to usage on the plateform after 2015. The current usage metrics is available 48-96 hours after online publication and is updated daily on week days.
Initial download of the metrics may take a while.