Fig. 3
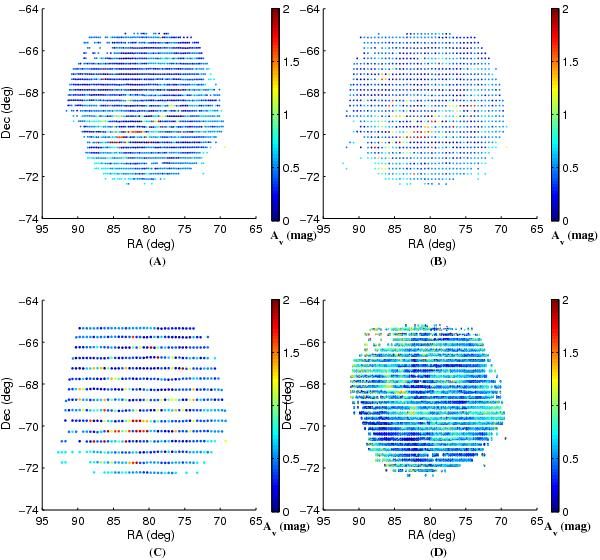
The extinction map of the LMC using MCPS data in the RA-Dec plane with three different area binning, A. 5.3 × 15 arcmin2, B. 10.5 × 15 arcmin2, and C. 10.5 × 30 arcmin2. The bottom right panel is the extinction map of Zaritsky et al. (2004), where the regions used in our analysis are selected and shown. Color coding is according to the Av value, which varies from 0.2 to 2.0 as shown in the color bar.
Current usage metrics show cumulative count of Article Views (full-text article views including HTML views, PDF and ePub downloads, according to the available data) and Abstracts Views on Vision4Press platform.
Data correspond to usage on the plateform after 2015. The current usage metrics is available 48-96 hours after online publication and is updated daily on week days.
Initial download of the metrics may take a while.