Fig. 23
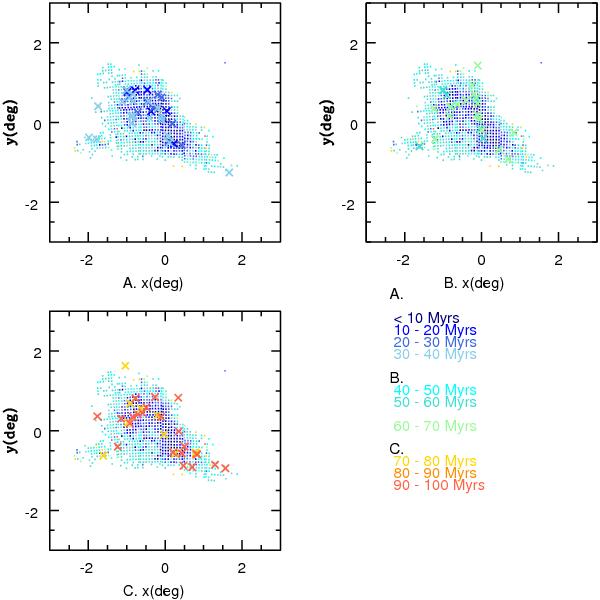
The age distribution of clusters as old as or younger than 100 Myrs (Glatt et al. 2010) overplotted with the LSFE map (same as Fig. 22) in the projected x − y plane of the sky. Three different age groups are shown, top left ≤ 40 Myr, top right 40–70 Myr, and bottom left 70–100 Myr. Color coding is according to the age as specified in the figure.
Current usage metrics show cumulative count of Article Views (full-text article views including HTML views, PDF and ePub downloads, according to the available data) and Abstracts Views on Vision4Press platform.
Data correspond to usage on the plateform after 2015. The current usage metrics is available 48-96 hours after online publication and is updated daily on week days.
Initial download of the metrics may take a while.