Free Access
Fig. 12
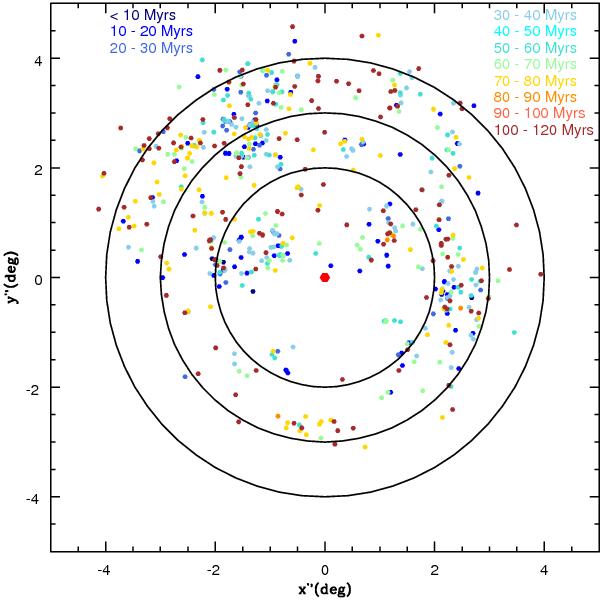
The spatial distribution of young clusters (<120 Myr) from Glatt et al. (2010) is plotted in the deprojected plane of the LMC. Color coding is according to cluster age as specified in the figure. The red dot is the optical center of the LMC. Concentric rings are drawn at radii 2°, 3°, and 4°.
Current usage metrics show cumulative count of Article Views (full-text article views including HTML views, PDF and ePub downloads, according to the available data) and Abstracts Views on Vision4Press platform.
Data correspond to usage on the plateform after 2015. The current usage metrics is available 48-96 hours after online publication and is updated daily on week days.
Initial download of the metrics may take a while.