Fig. 1
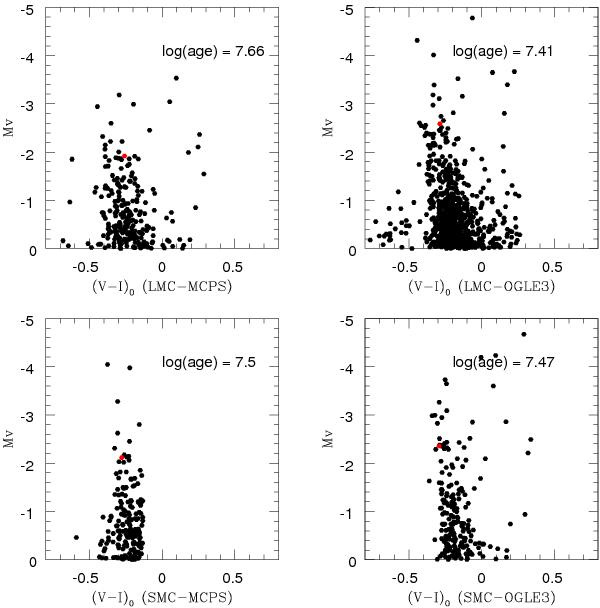
Mv vs. (V − I)0 CMDs for two regions each in the L&SMC. The top panels show two regions in the LMC, with left panel using MCPS data and the right using OGLE III data. Similarly, bottom panels show two regions in the SMC (left using MCPS and right using OGLE III). The red dot marks the turn-off point, and the estimated turn-off age is also shown.
Current usage metrics show cumulative count of Article Views (full-text article views including HTML views, PDF and ePub downloads, according to the available data) and Abstracts Views on Vision4Press platform.
Data correspond to usage on the plateform after 2015. The current usage metrics is available 48-96 hours after online publication and is updated daily on week days.
Initial download of the metrics may take a while.