Fig. 4
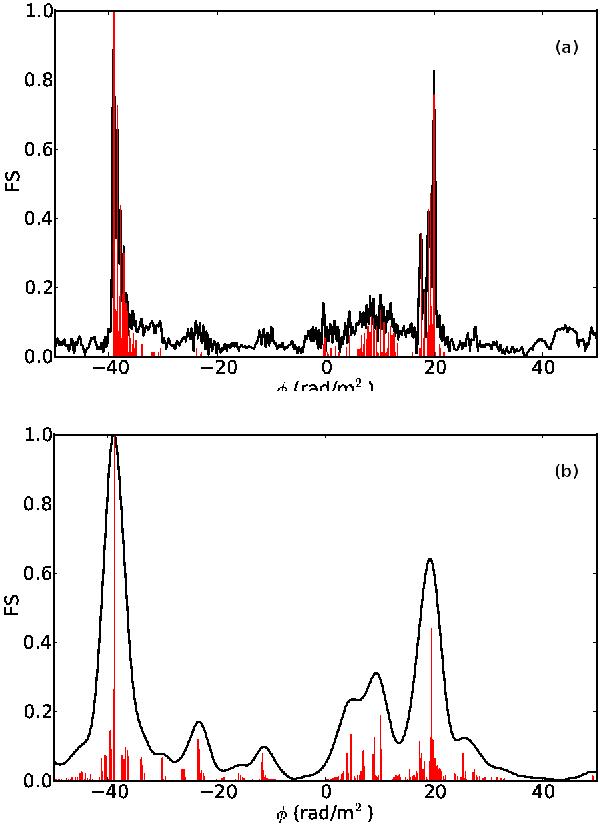
Mock observations of the Faraday spectrum shown in Fig. 2a. The spectrum has been observed over two frequency ranges: a) 110 to 250 MHz, similar to the LOFAR high band antennas and b) 300 to 900 MHz similar to the low frequency portion of the GMIMS survey. In each figure, the Faraday spectrum has been deconvolved using RMCLEAN. The black line represents the restored spectrum, while the RMCLEAN components are shown as vertical grey lines (red in the online version).
Current usage metrics show cumulative count of Article Views (full-text article views including HTML views, PDF and ePub downloads, according to the available data) and Abstracts Views on Vision4Press platform.
Data correspond to usage on the plateform after 2015. The current usage metrics is available 48-96 hours after online publication and is updated daily on week days.
Initial download of the metrics may take a while.