Fig. 3
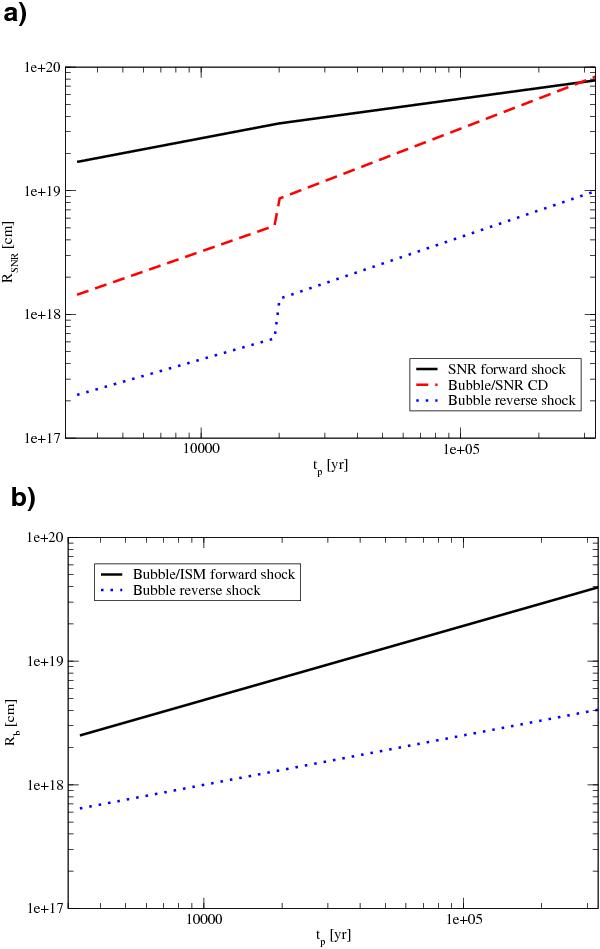
a) Evolution with time of the radii of the SNR/ISM forward shock (black solid line), SNR/bubble contact discontinuity (red dashed line), and bubble reverse shock (blue dotted line). The CD radius becomes larger than the SNR shock radius, which indicates that the model adopted here does not apply after a few × 105 yr. b) Evolution with time of the radii of the bubble/ISM forward (black solid line) and reverse shocks (blue dotted line).
Current usage metrics show cumulative count of Article Views (full-text article views including HTML views, PDF and ePub downloads, according to the available data) and Abstracts Views on Vision4Press platform.
Data correspond to usage on the plateform after 2015. The current usage metrics is available 48-96 hours after online publication and is updated daily on week days.
Initial download of the metrics may take a while.