Fig. 7
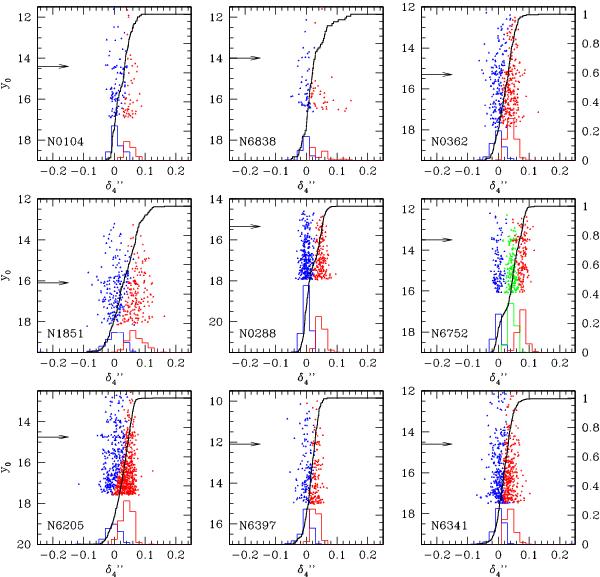
Distribution in  for the nine clusters, showing the large difference among the GCs. The stars are colored in blue or red (and green, only for NGC 6752) according to the separation made in δ4 (see previous figure); this division is only indicative. The colored histograms refer to the blue/red populations. The black, heavy lines represent the cumulative functions (to which the left y-axes refer) of all stars below the RGB bump, indicated by an arrow.
Current usage metrics show cumulative count of Article Views (full-text article views including HTML views, PDF and ePub downloads, according to the available data) and Abstracts Views on Vision4Press platform.
Data correspond to usage on the plateform after 2015. The current usage metrics is available 48-96 hours after online publication and is updated daily on week days.
Initial download of the metrics may take a while.