Fig. 6
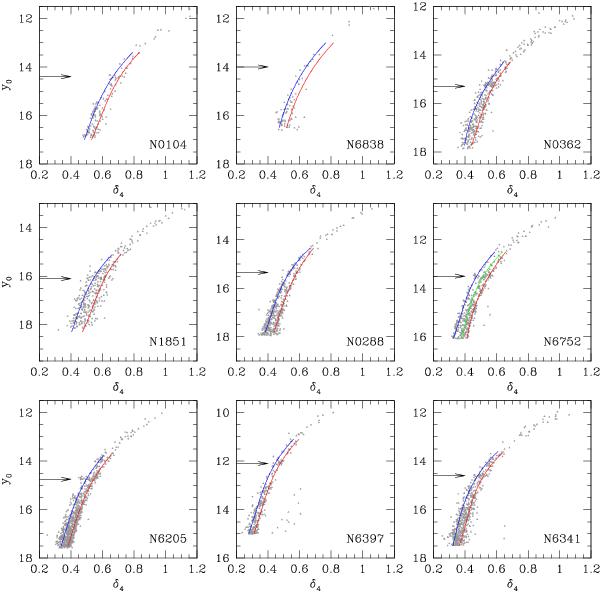
CMDs in δ4, y0 for the RGBs of the nine GCs, with the RGB bump level indicated by an arrow. The blue and red curves, stopped one magnitude brighter than the RGB bump, where the statistics begins to be too scarce, are polynomials describing the populations, drawn according to the distributions of P and IE stars in Fig. 5. For NGC 6752 the distribution of stars is trimodal (see text and next figure) and an intermediate (green) line is drawn.
Current usage metrics show cumulative count of Article Views (full-text article views including HTML views, PDF and ePub downloads, according to the available data) and Abstracts Views on Vision4Press platform.
Data correspond to usage on the plateform after 2015. The current usage metrics is available 48-96 hours after online publication and is updated daily on week days.
Initial download of the metrics may take a while.