Free Access
Fig. 2
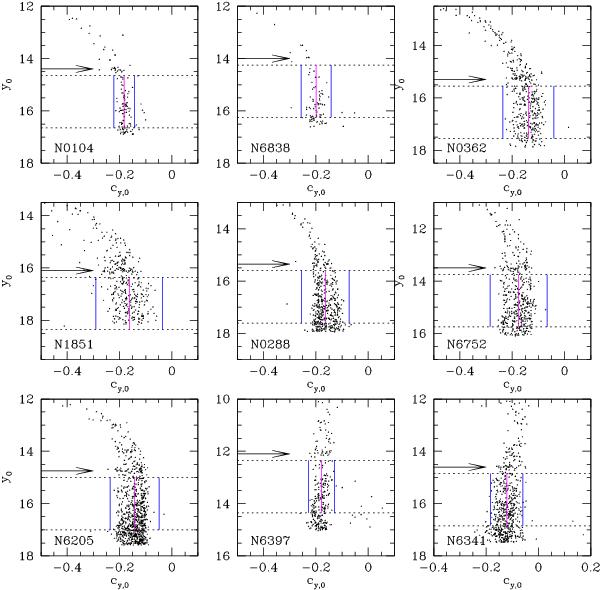
Enlargement of the RGB region for the CMDs in y0, cy,0 of the nine GCs. An arrow shows the assumed magnitude of the RGB bump. The lines indicate the RGB stars selected to derive average and rms values for cy,0 (see Sect. 4).
Current usage metrics show cumulative count of Article Views (full-text article views including HTML views, PDF and ePub downloads, according to the available data) and Abstracts Views on Vision4Press platform.
Data correspond to usage on the plateform after 2015. The current usage metrics is available 48-96 hours after online publication and is updated daily on week days.
Initial download of the metrics may take a while.