Free Access
Fig. 10
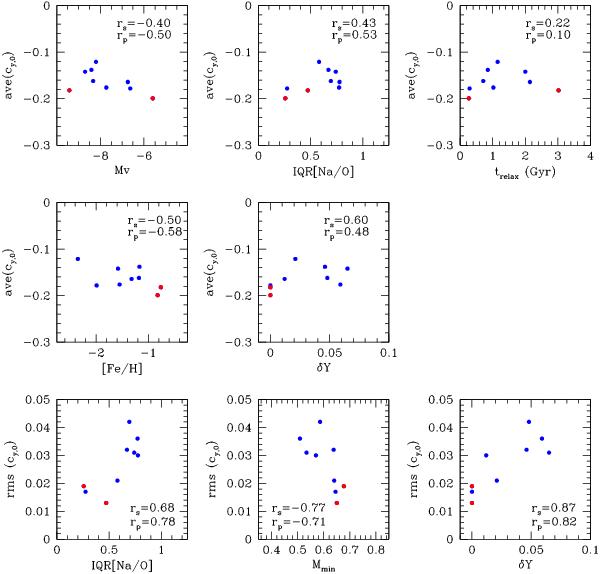
Correlations of the average and rms for cy,0 with some interesting parameters. The two metal-rich clusters are indicated by red points. rS and rP are the Spearman’s rank and Pearson’s linear correlation coefficients, respectively.
Current usage metrics show cumulative count of Article Views (full-text article views including HTML views, PDF and ePub downloads, according to the available data) and Abstracts Views on Vision4Press platform.
Data correspond to usage on the plateform after 2015. The current usage metrics is available 48-96 hours after online publication and is updated daily on week days.
Initial download of the metrics may take a while.