Fig. 10
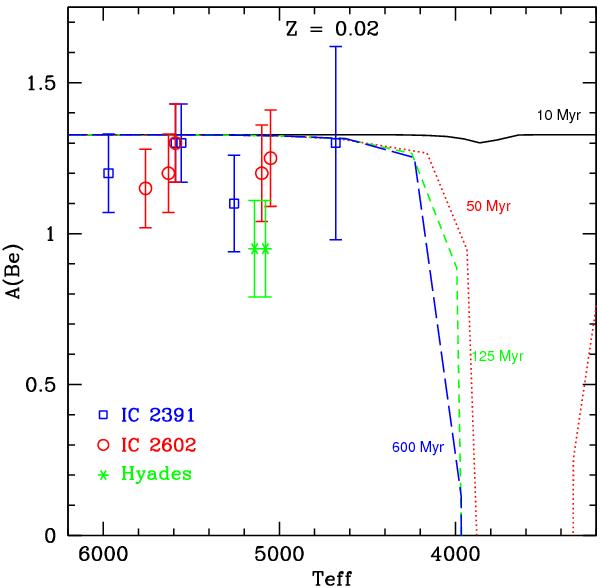
Comparison of the Be abundances with the theoretical models of Siess et al. (2000). The curves show the Be abundance for stars with solar metallicity at the main sequence as a function of effective temperatures. Four different ages are shown: 10 Myr as a black solid curve, 50 Myr as a red dotted curve, 125 Myr as a green short-dashed curve, and 600 Myr as a blue long-dashed curve. Symbols for the stars are as in Fig. 9.
Current usage metrics show cumulative count of Article Views (full-text article views including HTML views, PDF and ePub downloads, according to the available data) and Abstracts Views on Vision4Press platform.
Data correspond to usage on the plateform after 2015. The current usage metrics is available 48-96 hours after online publication and is updated daily on week days.
Initial download of the metrics may take a while.