Fig. 7
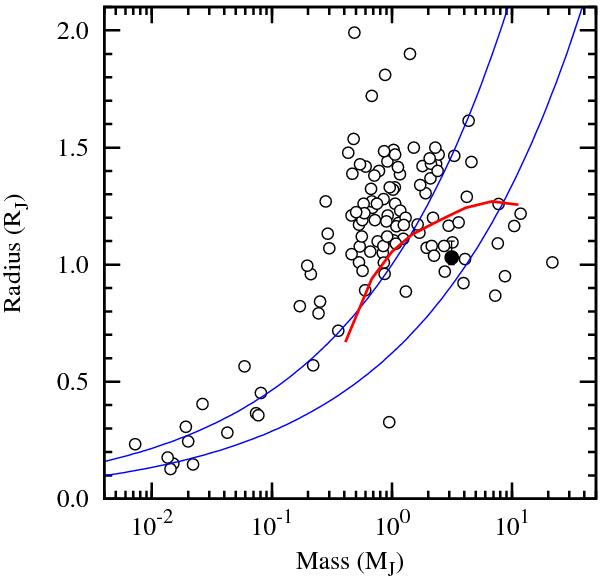
The mass-radius diagram for currently known transiting exoplanets (grey dots). The black spot marks WASP-10 b. The density contours of Jupiter (upper) and Earth (lower) are plotted with blue lines. The red line sketches the planetary isochrone for a 100 M ⊕ core planet, the interpolated equivalent semi-major axis of WASP-10 b, and the age of 300 Myr (Fortney et al. 2007).
Current usage metrics show cumulative count of Article Views (full-text article views including HTML views, PDF and ePub downloads, according to the available data) and Abstracts Views on Vision4Press platform.
Data correspond to usage on the plateform after 2015. The current usage metrics is available 48-96 hours after online publication and is updated daily on week days.
Initial download of the metrics may take a while.