Fig. 6
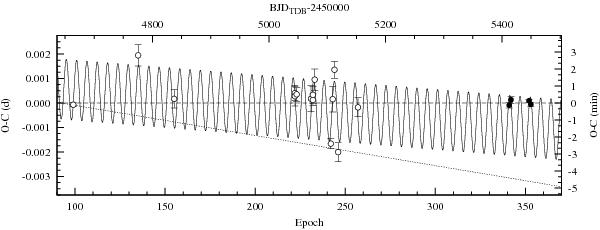
The O–C diagram for mid-transit times of WASP-10 b. The mid-transits published in the literature are marked with open symbols. The filled ones denotes new mid-transit times determined by us. The periodic signal predicted by Maciejewski et al. (2011) is sketched with a continuous line. The dashed line shows the refined linear ephemeris and the dotted one marks the linear ephemeris provided by Dittmann et al. (2010).
Current usage metrics show cumulative count of Article Views (full-text article views including HTML views, PDF and ePub downloads, according to the available data) and Abstracts Views on Vision4Press platform.
Data correspond to usage on the plateform after 2015. The current usage metrics is available 48-96 hours after online publication and is updated daily on week days.
Initial download of the metrics may take a while.