Free Access
Fig. 3
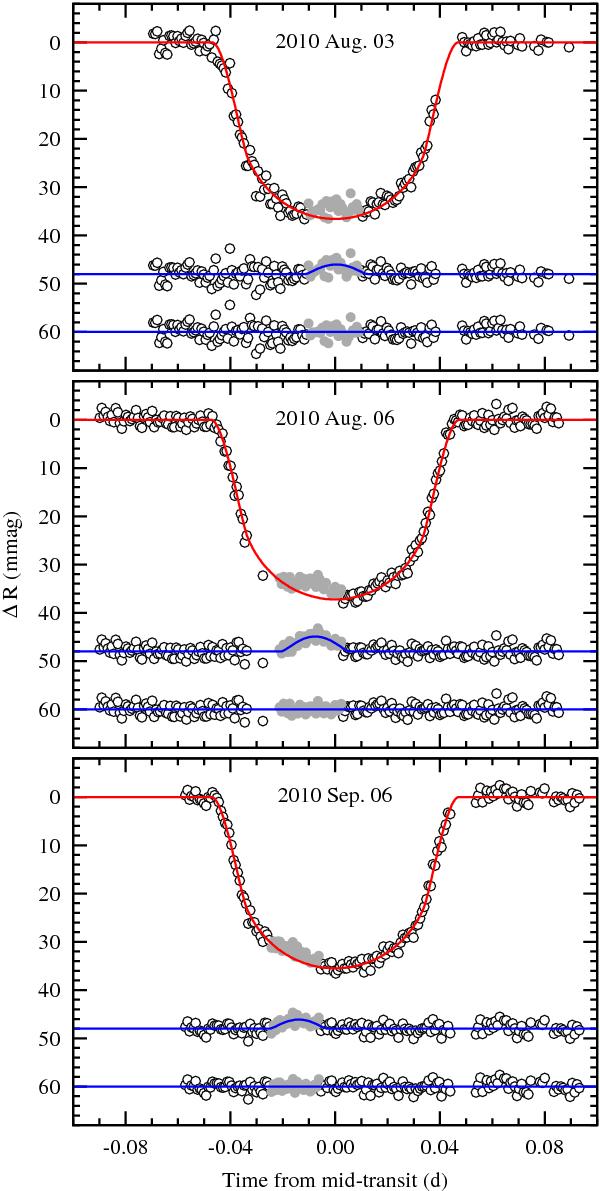
Light curves for three transits of WASP-10 b with individually fitted model light curves after rejecting data points affected by stellar spots (grey points). The residuals that were used to model starspot features are plotted in the middle graphs. In the bottom graphs, the final residuals are plotted.
Current usage metrics show cumulative count of Article Views (full-text article views including HTML views, PDF and ePub downloads, according to the available data) and Abstracts Views on Vision4Press platform.
Data correspond to usage on the plateform after 2015. The current usage metrics is available 48-96 hours after online publication and is updated daily on week days.
Initial download of the metrics may take a while.