Fig. 8
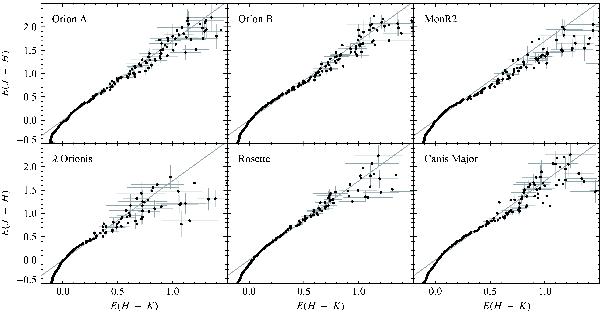
The reddening law as measured on various complexes. The plots show the color excess on J − H as a function of the color excess on H − K. Error bars are uncertainties evaluated from the photometric errors of the 2MASS catalog and taking into account also the intrinsic scatter in the individual colors of the stars, as derived from the control field. The solid line shows the normal infrared reddening law (Indebetouw et al. 2005). A significant discrepancy is observed for Mon R2 and possibly for λ Orionis, while other clouds are in very good agreement with the normal infrared reddening law.
Current usage metrics show cumulative count of Article Views (full-text article views including HTML views, PDF and ePub downloads, according to the available data) and Abstracts Views on Vision4Press platform.
Data correspond to usage on the plateform after 2015. The current usage metrics is available 48-96 hours after online publication and is updated daily on week days.
Initial download of the metrics may take a while.