Fig. 2
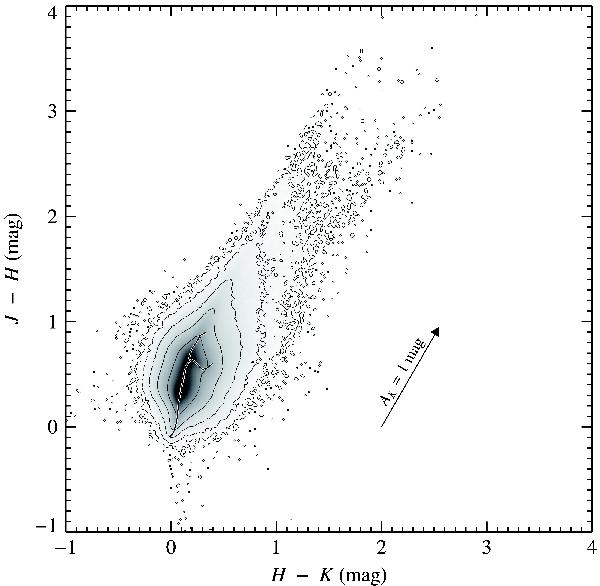
Color-color diagram of the stars in the whole field. The contours are logarithmically spaced, with each contour representing a density ten times larger than the enclosing contour; the outer contour detects single stars. Only stars with accurate photometry in all bands (maximum 1-σ errors allowed 0.1 mag) have been included in this plot. The diagonal spread of stars is due to reddening along the marked reddening vector of dwarf and giant stars. The expected colors of these stars, as predicted by Bessell & Brett (1988) and converted into the 2MASS photometric system using the relations from (Carpenter 2001), are shown in the plot, and match very well the observed colors.
Current usage metrics show cumulative count of Article Views (full-text article views including HTML views, PDF and ePub downloads, according to the available data) and Abstracts Views on Vision4Press platform.
Data correspond to usage on the plateform after 2015. The current usage metrics is available 48-96 hours after online publication and is updated daily on week days.
Initial download of the metrics may take a while.