Fig. 1
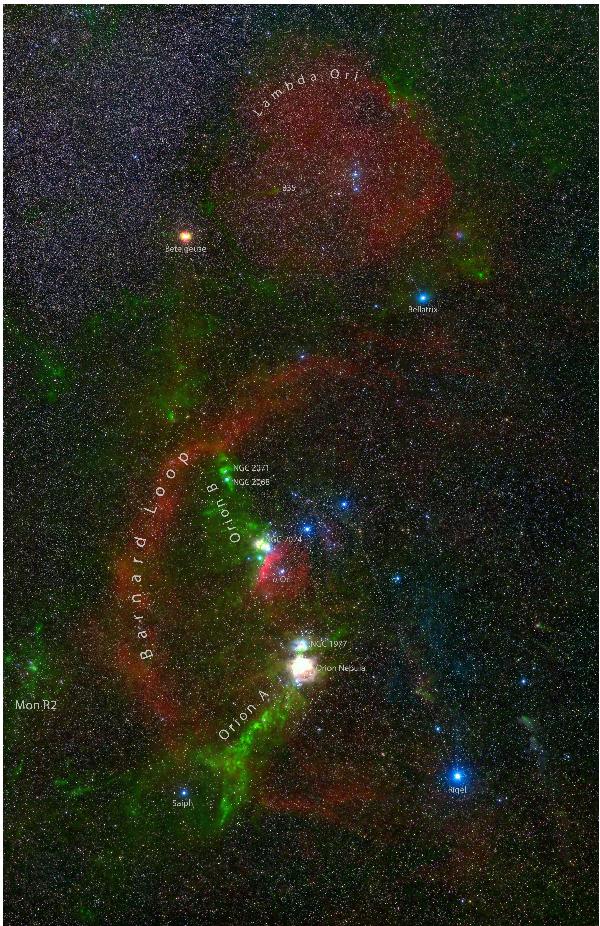
An optical image of Orion (Wei-Hao Wang, IfA, University of Hawaii) with the extinction map presented in this paper superimposed in green. The complementarity between the red Hii regions and the green H2 ones is evident. Note that the online figure is interactive: extinction and labels can be toggled by clicking on the respective boxes when using Adobe Acrobat.
Current usage metrics show cumulative count of Article Views (full-text article views including HTML views, PDF and ePub downloads, according to the available data) and Abstracts Views on Vision4Press platform.
Data correspond to usage on the plateform after 2015. The current usage metrics is available 48-96 hours after online publication and is updated daily on week days.
Initial download of the metrics may take a while.