Fig. 8
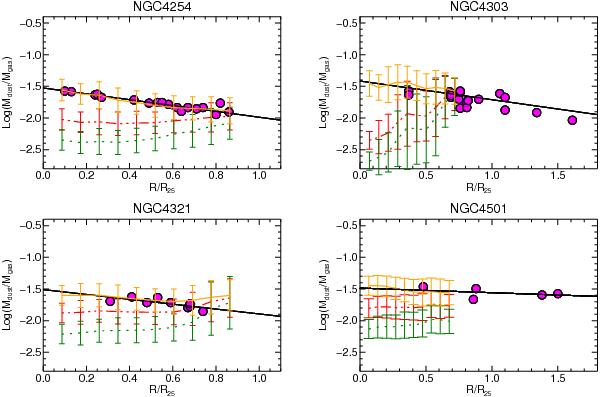
Dust-to-gas mass ratio and metallicity radial profiles with the conversion factor XCO 0.1 − 0.9 × 1020 cm-2 (K km s (see text for the XCOadopted for each galaxy-orange solid curves), and with constant XCO = 1.8 × 1020 cm-2 (red dot-dashed curves) and XCO = 4.0 × 1020 cm-2 (green dotted curves). The magenta circles are the oxygen abundance converted to the dust-to-gas scale with Eq. (3). The continuous black lines show the fit to the abundance data.
Current usage metrics show cumulative count of Article Views (full-text article views including HTML views, PDF and ePub downloads, according to the available data) and Abstracts Views on Vision4Press platform.
Data correspond to usage on the plateform after 2015. The current usage metrics is available 48-96 hours after online publication and is updated daily on week days.
Initial download of the metrics may take a while.