Fig. 2
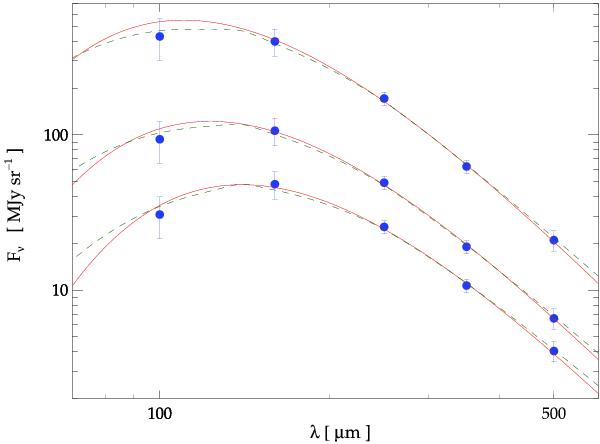
Typical SEDs on three different positions (pixels) on NGC 4254. Blue dots are the measured (color-corrected) fluxes and the red (solid) + curves are the modified blackbody fits. The three SED correspond to minimum (≈21 K), mean (≈23.5 K), and maximum (≈26 K) temperature in the galaxy (see Fig. 3). The green (dashed) curves show the fit of the Draine & Li (2007) model to the data, for IRSFs of intensities 2, 4 and 8 times the Local ISRF (see their paper for details).
Current usage metrics show cumulative count of Article Views (full-text article views including HTML views, PDF and ePub downloads, according to the available data) and Abstracts Views on Vision4Press platform.
Data correspond to usage on the plateform after 2015. The current usage metrics is available 48-96 hours after online publication and is updated daily on week days.
Initial download of the metrics may take a while.