Free Access
Fig. 6
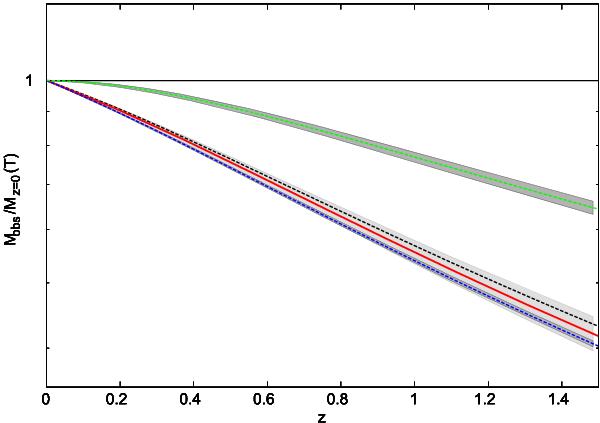
Redshift evolution of the M–T relation. Continuous red line and light grey confidence area: observed evolution. Green-dashed line and dark grey confidence area: MGS FO run. Blue-dashed line and dark grey confidence area: MGS PC run. Black-dashed line: self-similar prediction.
Current usage metrics show cumulative count of Article Views (full-text article views including HTML views, PDF and ePub downloads, according to the available data) and Abstracts Views on Vision4Press platform.
Data correspond to usage on the plateform after 2015. The current usage metrics is available 48-96 hours after online publication and is updated daily on week days.
Initial download of the metrics may take a while.