Fig. 6
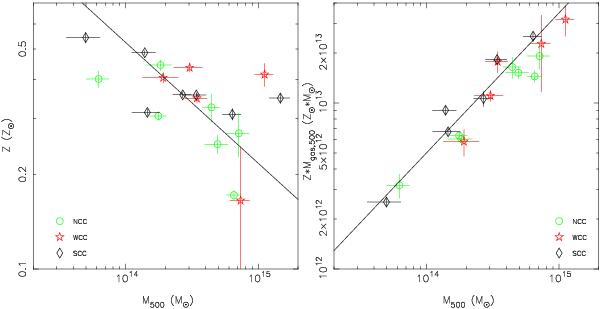
Iron abundance (left panel) and iron mass (right panel) vs. total mass and their best fits. The symbols have the same meaning as those in Fig. 1. This finding agrees with the trend seen in simulations (e.g., Fig. 11 in Fabjan et al. 2010) toward less massive clusters having lower gas-mass fractions but higher iron-mass fractions, so that the gas is more metal-rich in those systems.
Current usage metrics show cumulative count of Article Views (full-text article views including HTML views, PDF and ePub downloads, according to the available data) and Abstracts Views on Vision4Press platform.
Data correspond to usage on the plateform after 2015. The current usage metrics is available 48-96 hours after online publication and is updated daily on week days.
Initial download of the metrics may take a while.