Fig. 8
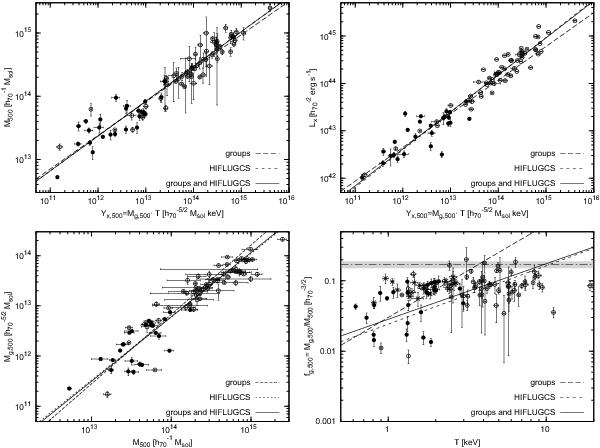
Yx and gas fraction relations at r500. Top left: M − Yx relation. Top right: Lx − Yx relation. Lower left: Mg − M relation. Lower right: fg − T relation. Filled circles are groups, open circles are HIFLUGCS clusters (gas masses from Zhang et al. 2011), and asterisks are the groups from Sun et al. (2009). The dot-dashed line with shaded error regions is the cosmic baryon fraction from WMAP5 (Dunkley et al. 2009).
Current usage metrics show cumulative count of Article Views (full-text article views including HTML views, PDF and ePub downloads, according to the available data) and Abstracts Views on Vision4Press platform.
Data correspond to usage on the plateform after 2015. The current usage metrics is available 48-96 hours after online publication and is updated daily on week days.
Initial download of the metrics may take a while.