Fig. 2
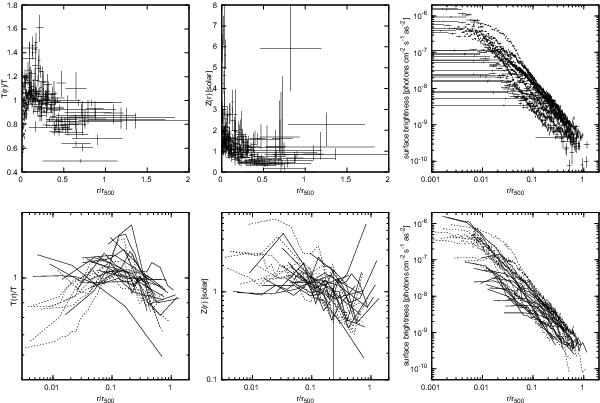
Top row, left to right: temperature profiles scaled by r500 and global temperature (linear), metallicity profiles scaled by r500 (linear), surface brightness profiles scaled by r500 (logarithmic). Bottom row: same as above, but all plotted with lines, in logarithmic scale. Groups where a low-temperature core has been removed are shown as dotted lines.
Current usage metrics show cumulative count of Article Views (full-text article views including HTML views, PDF and ePub downloads, according to the available data) and Abstracts Views on Vision4Press platform.
Data correspond to usage on the plateform after 2015. The current usage metrics is available 48-96 hours after online publication and is updated daily on week days.
Initial download of the metrics may take a while.