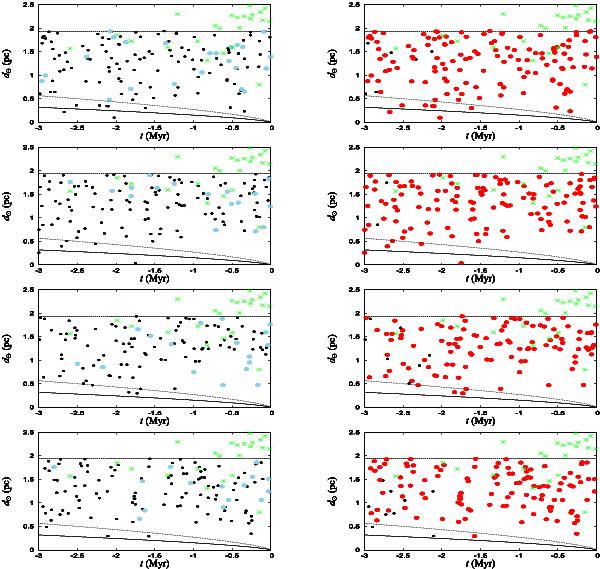
Fig. 9

For four different instants (one per line), we plot the encounter distance of stars versus the time of encounter counted from the perihelion passage of an injected comet (t = 0). The two curves indicate at which distance the comet would have been on a parabolic (dotted) or elliptic orbit (solid; the comet being at aphelion in this case). The black dots correspond to all the simulated stars passing during the 3 Myr time span. In the left column, the sky-blue dots show the stars detected by Hipparcos. The same is done using red dots in the right column for the stars detected by Gaia. The green asterisks indicate the real stars identified by Dybczyński (2006). His sample extends to larger encounter distances than those of our simulation.
Current usage metrics show cumulative count of Article Views (full-text article views including HTML views, PDF and ePub downloads, according to the available data) and Abstracts Views on Vision4Press platform.
Data correspond to usage on the plateform after 2015. The current usage metrics is available 48-96 hours after online publication and is updated daily on week days.
Initial download of the metrics may take a while.


