Fig. 5

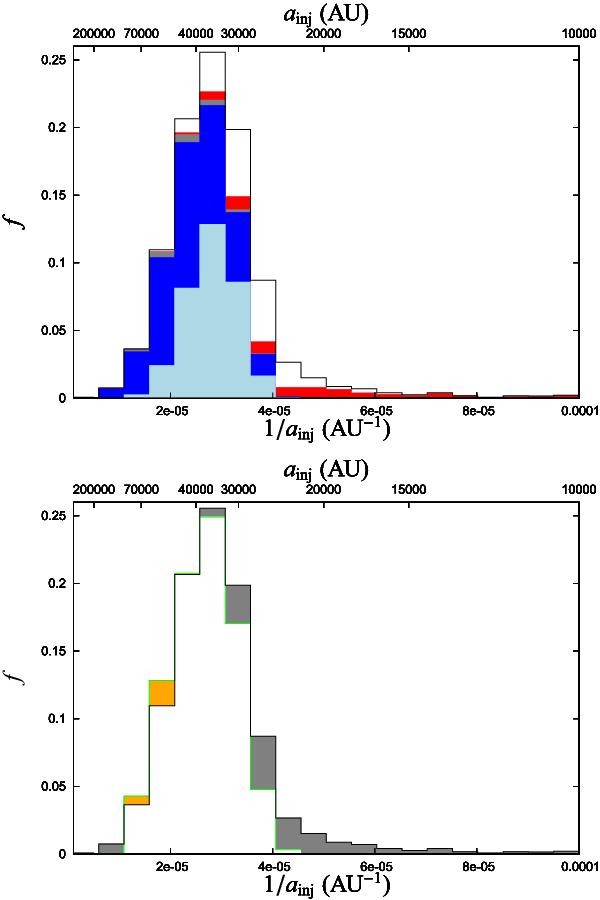
Fraction f of quiescent injected comets with respect to the total number (6119) plotted as a histogram versus the inverse of the semi-major axis at injection (the upper horizontal scale gives the corresponding semi-major axis). Two percent of the injected comets have ainj < 10000 AU and fall to the right of the diagram. In the upper panel, the dark-blue area corresponds to comets belonging exclusively to set G, the sky-blue area corresponds to comets belonging to sets G and G′ but not to set S, the grey area corresponds to comets belonging to sets G and S, the red area corresponds to comets belonging to only set S, and the white area to comets belonging to neither set. In the lower panel, the green line gives the estimated fraction of injections when the stellar perturbations are turned off during the last revolution. The orange and grey areas correspond to the excess and shortage, respectively, of the number of injections in this case.
Current usage metrics show cumulative count of Article Views (full-text article views including HTML views, PDF and ePub downloads, according to the available data) and Abstracts Views on Vision4Press platform.
Data correspond to usage on the plateform after 2015. The current usage metrics is available 48-96 hours after online publication and is updated daily on week days.
Initial download of the metrics may take a while.


