Fig. 7
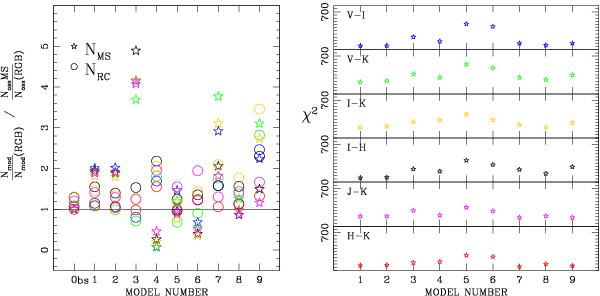
Left panel: the ratio of the number of stars falling on the Main Sequence (MS, stars) and the RC (circles) to those on the RGB, as outlined in Fig. 5, for both observations and models for different filter combinations. These ratios have been normalized to the observed MS/RGB ratio. Right panel: the χ2 values for different combinations of filters for the set of models defined in Fig. 6, using a bin size of 0.15 in magnitudes and 0.25 in colour (see text for details). For this computation we have used only the stars in F2, with V,I,J,H and Ks photometry. Both panels: the colour code (only in the electronic version) is blue for V − I, green for V − Ks, yellow for I − Ks, black for I-H, magenta for J − Ks and red for H − Ks.
Current usage metrics show cumulative count of Article Views (full-text article views including HTML views, PDF and ePub downloads, according to the available data) and Abstracts Views on Vision4Press platform.
Data correspond to usage on the plateform after 2015. The current usage metrics is available 48-96 hours after online publication and is updated daily on week days.
Initial download of the metrics may take a while.