Fig. 5
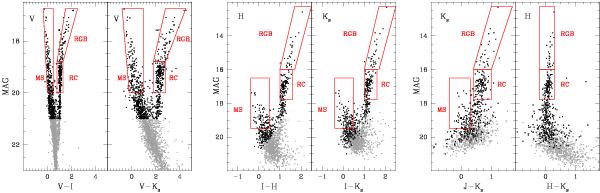
Colour–magnitude diagrams for our LMC bar field in different filter combinations. Starting from optical HST/ACS V,V − I (1st panel on the left), and extending to optical-IR, by adding MAD H and Ks photometry (central panels), and finally the MAD IR photometry alone (panels on the right). The grey points are all the sources found by Allframe and matched between different filters, and the black are only those with a completeness higher than 50% (see Sect. 3). The boxes outline the main features of the CMDs, the main sequence (MS), the red giant branch (RGB) and the red clump (RC).
Current usage metrics show cumulative count of Article Views (full-text article views including HTML views, PDF and ePub downloads, according to the available data) and Abstracts Views on Vision4Press platform.
Data correspond to usage on the plateform after 2015. The current usage metrics is available 48-96 hours after online publication and is updated daily on week days.
Initial download of the metrics may take a while.