Fig. 3
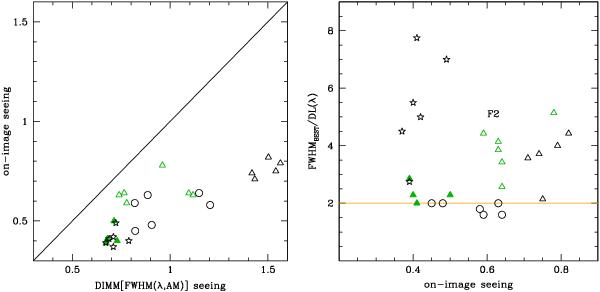
Triangles, dots and stars represent Ks, H and J measurements, respectively. They are colour coded according to the airmass at which the observations were taken (≤1.5 black; > 1.5 green). Filled and empty symbols represent F1 and F2 images, respectively. Left panel: the seeing measured by the DIMM [FWHM (λ, AM)] scaled to the actual airmass and wavelength by using the standard relation given in the text is plotted against the FWHM measured on the sky images taken in open loop (⟨FWHMsky ⟩ , or on-image seeing). Right panel: the ratio between the best FWHM of the Point Spread Function (PSF) measured in each image and the diffraction limit as a function of on-image seeing for the same data shown in the left panel. The solid (orange) line is 2 times the diffraction limit.
Current usage metrics show cumulative count of Article Views (full-text article views including HTML views, PDF and ePub downloads, according to the available data) and Abstracts Views on Vision4Press platform.
Data correspond to usage on the plateform after 2015. The current usage metrics is available 48-96 hours after online publication and is updated daily on week days.
Initial download of the metrics may take a while.