Fig. 2
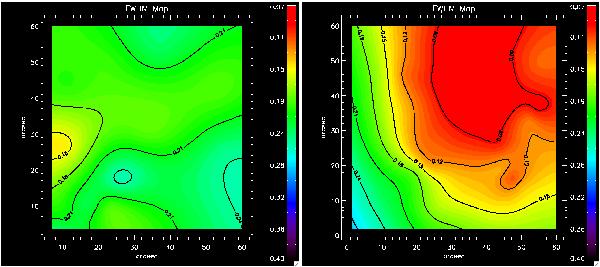
The FWHM variation measured across the field F1 in Ks filter (left) and across the field F2 in H filter (right). The FWHM scale ranges from 0.07′′ to 0.5′′, as is shown by the colour bars on the right. The (black) contours identify iso-density levels with a step of 0.03′′. Left panel: the FWHM is quite uniform varying from 0.15′′ to 0.24′′. This field is well centered between the three guide stars. Right panel: the FWHM is very good (0.09′′) near the guide star GS1 (upper right hand corner), but the correction rapidly declines (down to 0.24′′) towards the opposite corner.
Current usage metrics show cumulative count of Article Views (full-text article views including HTML views, PDF and ePub downloads, according to the available data) and Abstracts Views on Vision4Press platform.
Data correspond to usage on the plateform after 2015. The current usage metrics is available 48-96 hours after online publication and is updated daily on week days.
Initial download of the metrics may take a while.