Fig. 1
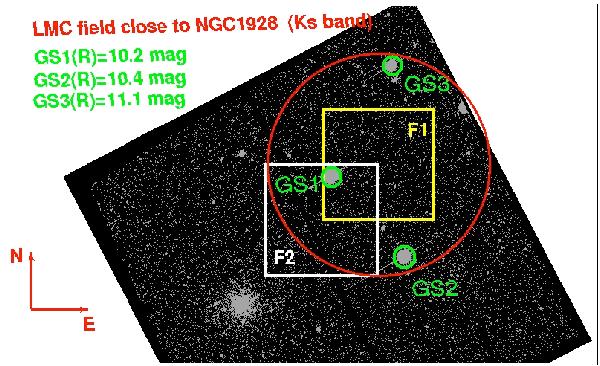
An HST/ACS image in F555W band of the LMC field observed with MAD. The large (red) circle represents the entire MAD corrected field of view. This field is only partially covered by the detector, and the two observed fields F1 and F2 are indicated by squares. The three guide stars are indicated by small (green) circles (see Table 1 for details).
Current usage metrics show cumulative count of Article Views (full-text article views including HTML views, PDF and ePub downloads, according to the available data) and Abstracts Views on Vision4Press platform.
Data correspond to usage on the plateform after 2015. The current usage metrics is available 48-96 hours after online publication and is updated daily on week days.
Initial download of the metrics may take a while.